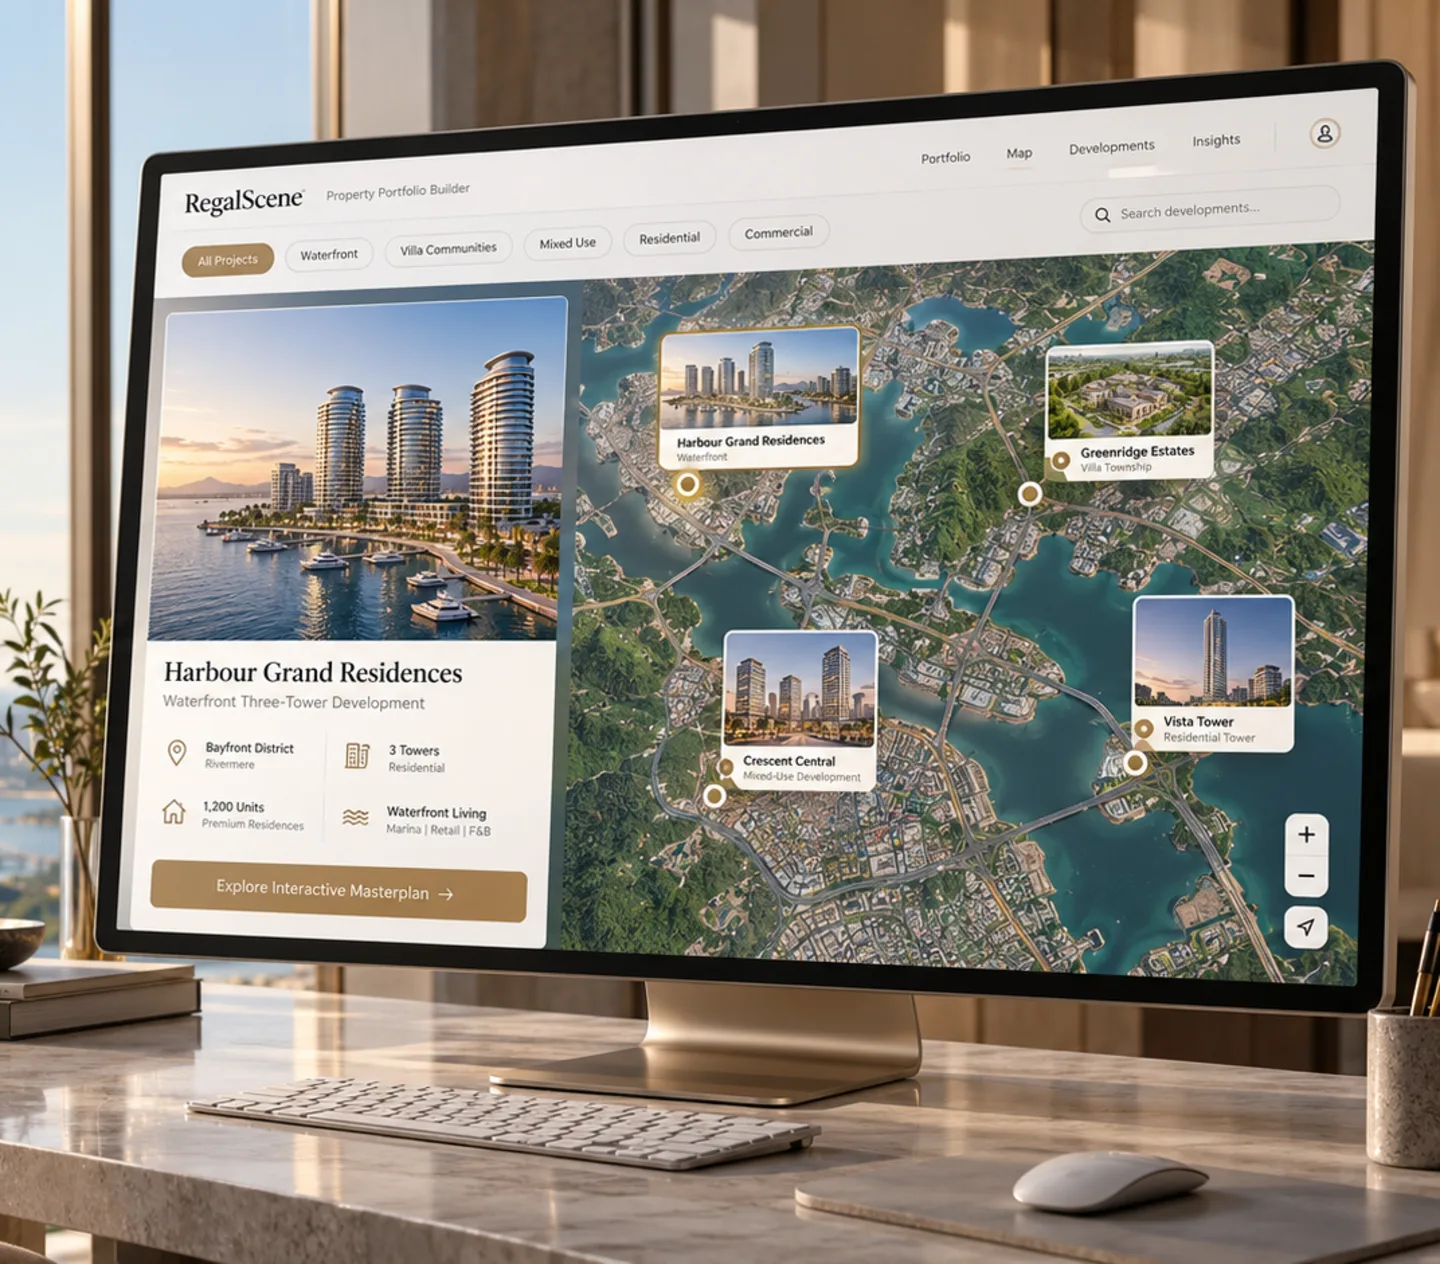
Enterprise portfolio intelligence
From portfolio map to unit-level intelligence.
See every project across your portfolio, move inside the development, and understand performance all the way down to the individual unit.
The problem
Your GIS shows where the project is. It does not show what is happening inside it.
A group running a dozen developments already knows where its land is. What it cannot do easily is move from that map into a tower, onto a floor, and onto the specific units that are still unsold, while carrying the commercial picture along with it.
The information exists. It is just distributed. Geography sits in GIS, buyers in the CRM, values in finance, stock in an inventory list, and campaign results in an analytics tool. Leadership receives dashboards, sales receives availability, finance receives spreadsheets, and each is accurate on its own.
Nobody has one way to walk through the property itself and see the business attached to it.
The idea
Start with the portfolio. End with the asset.
Choose a role, open a development, and keep going down. The figures re-scope at every step, because every number on a portfolio report belongs to something physical.
Portfolio view
Select a development to move inside it.
12 projects
CEO view
Group portfolio
12 developments · 8,460 units
- Sell-through
- 71%
- Projects below plan
- 3 of 12
- Unsold inventory
- 2,410 units
Portfolio health, concentration and the exceptions worth your attention.
Inventory and sell-through come from RegalScene. Portfolio value and targets come from the systems you connect.
Worked example with illustrative figures, not a customer portfolio.
A portfolio says 71% sold. The useful questions start immediately afterwards: which project, which tower, which floor, what is left, and what is it worth.
Role-based intelligence
One portfolio. Different decisions.
The same property hierarchy serves five very different conversations. What changes between them is the measure in front of the person, not the underlying model, which is why a question can move between roles without anyone exporting anything.
CEO
Portfolio health
Sell-through, concentration, project ranking and the exceptions worth a second look.
Executive
Project performance
Delivery stage, release progress, inventory and cross-project comparison.
Finance
Value and exposure
Where value sits, what is committed, and which inventory is ageing.
Marketing
Demand signals
Which developments, towers and unit types buyers actually explore.
Sales
Availability and intent
Live availability, reservations, leads and the journey behind each enquiry.
Where it sits
What does this add to the GIS we already have?
A layer, not a replacement. GIS stays the authority on geography. RegalScene is where the property itself becomes explorable, and where your commercial systems get somewhere physical to attach to.
GIS
Location and geography
Where the asset is.
RegalScene
Project and unit exploration
What is inside it.
Your systems
Commercial data
How it is performing.
RegalScene connects to the systems and data sources appropriate to your environment, scoped as part of the implementation. Existing geographic data can be incorporated, with preparation and transformation sized against your source formats rather than assumed.
The shift
Not another BI dashboard. A visual operating layer for your property portfolio.
Dashboards are good at telling you the number. They are poor at letting you walk into the thing the number describes. The difference matters most in the meeting where somebody asks what is actually left in a tower, and the honest answer is that nobody can show it without leaving the room.
The questions
Ask a portfolio question. Find the property behind the answer.
These are the questions leadership asks in the room. Each one ends somewhere physical, which is why answering them usually means somebody leaves and comes back a day later.
- Which projects are holding the most unsold inventory?
- Where is our remaining inventory physically concentrated?
- Which unit types are generating the strongest demand?
- Which towers are selling slower than the rest of their project?
- Which projects attract interest but not enquiries?
- Where does our highest-value available inventory actually sit?
- What is genuinely still available in this development?
- Which units are buyers spending their time on?
How it fits together
How much of this is RegalScene, and how much is yours?
RegalScene owns the property model and the exploration. Your systems keep owning the commercial truth. Nothing here becomes a system of record that was not one already.
GIS and spatial data
CRM
Inventory
ERP and finance
Marketing analytics
RegalScene Enterprise
The property hierarchy, the portfolio map and the visual exploration layer
CEO
Executive
Finance
Marketing
Sales
The foundation
The same property model, extended upward.
This is not a separate analytics product bolted on beside the sales platform. It is the hierarchy developers already run on us, extended up to the portfolio instead of stopping at one project.
Where it earns its place
What enterprises use it for.
Portfolio reviews
Walk every development from one visual portfolio instead of assembling a deck from four systems.
Executive reporting
Move from a headline number straight into the project, tower and units underneath it.
Inventory strategy
See where unsold stock sits physically as well as commercially, and which of it is ageing.
Sales planning
Compare availability, demand and activity across projects before committing a release.
Marketing intelligence
Learn which towers and unit types buyers explore, rather than which pages they loaded.
Management meetings
Use the portfolio itself as the interface, instead of moving between a map, a deck and a spreadsheet.
Questions
Questions enterprise teams ask
Does this replace our GIS?
No, and it is not designed to. GIS answers where an asset is, and it remains the authority on that. RegalScene answers what is inside the asset and how it is performing commercially. The two sit alongside each other: most enterprises keep GIS exactly as it is and use RegalScene as the layer their teams explore the property through.
Is RegalScene the system of record for our commercial data?
No. Your CRM, ERP and finance systems stay the record. RegalScene holds the property hierarchy, inventory status and the buyer's journey, and presents your commercial figures against the physical asset they belong to. It is a visual operating layer, not a replacement for the systems underneath it.
What can RegalScene connect to?
Connection is scoped to the systems and data sources appropriate to your environment, as part of the implementation. Existing geographic and GIS data can be incorporated, with preparation and transformation scoped against your source formats. CRM integration is available as part of a project implementation and is scoped around your CRM and sales workflow. There is no self-serve connector catalogue, and we would rather say so than imply one.
What ships today, and what is configured per customer?
The property hierarchy, inventory states, the portfolio map, role-based access and the buyer-journey analytics are shipped product. Which commercial measures each role sees, and where those figures come from, is configured per enterprise implementation against the systems you connect.
Can this run inside our own environment?
Dedicated and customer-controlled deployment models are available for enterprise requirements, subject to solution design. Tenant isolation is architectural rather than a hosting option, so data separation holds on every model.

Your portfolio already has the data. Make it explorable.
Bring projects, inventory and performance into one visual experience built around the way property portfolios actually work. The useful first conversation is about your own portfolio, not a demonstration.