A buyer can explore a building, compare floor plans, and inspect a unit, yet still have a basic question unanswered: where does this development fit into the wider city?
The master plan explains the project. It does not always explain the surroundings, the connections between developments, or the other projects the developer has available.
RegalScene Geographic adds that wider view. It brings a geographic layer above the project, connecting a developer's portfolio to the property experiences already inside it.
RegalScene brings Web GIS into the property sales experience.
Before the project boundary
RegalScene's project experience follows a familiar path:
Project → Master Plan → Building → Floor → Unit
An interactive master plan helps a buyer understand the development and move into its details. That remains essential.
But a buyer choosing between developments starts earlier. They need to understand where each project sits, what surrounds it, and how it relates to the developer's other properties.
For a sales team presenting several developments, opening a separate project experience for each one leaves that comparison to the buyer.
The portfolio needs an entry point of its own.
What Web GIS means for real estate
Web GIS broadly means using web technologies to deliver and interact with geographic information. A person can open a map in a browser, explore locations, and interact with information connected to those places.
Esri describes Web GIS as the combination of the web and geographic information systems. Its applications extend across mapping, information sharing, planning, and analysis. Esri's introduction to Web GIS explains that broader scope.
RegalScene applies a focused part of that idea: Web GIS for real estate portfolio presentation and buyer exploration.
It is an interactive real-estate experience platform with Web GIS capabilities. The geographic layer helps buyers understand the portfolio and choose a project to explore.
The portfolio becomes a geographic experience
A developer can present a portfolio as a grid of projects, a map, or offer both views so the buyer can switch between them.
The grid supports browsing by project. The map makes location and the relationship between developments part of that decision.
A buyer might begin with the wider portfolio, move toward a particular district, select a project, and then enter its existing property experience. Geography becomes the first stage of the journey.
This extends the idea behind a property portfolio map: one entry point that connects several projects.
The map gives the portfolio a geographic structure that project cards alone cannot provide.
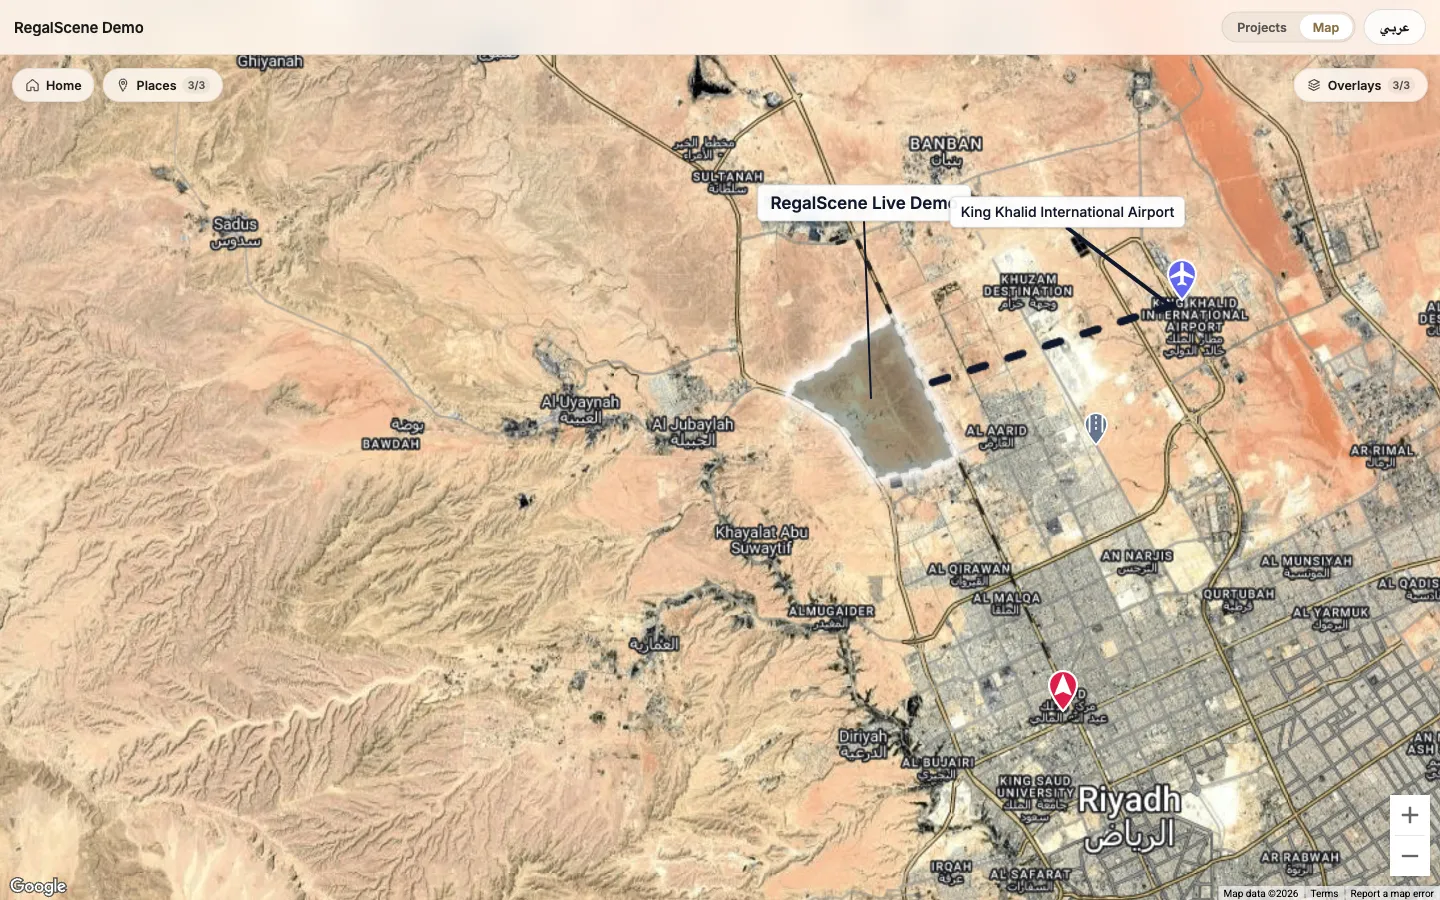 Live demoExplore the geographic portfolio demoopens the interactive RegalScene demo in a new tab
Google provides the geography. RegalScene provides the property experience.
Google Maps supplies the geographic foundation. RegalScene supports roadmap, satellite, and hybrid presentation, with the developer's authored content placed over it.
Roadmap emphasizes streets and map labels. Satellite provides aerial imagery. Hybrid combines that imagery with map labels, as described in Google's map-type documentation.
RegalScene adds the property layer: projects, boundaries, routes, points of interest, labels, and connections into the project experience.
Projects are the primary subjects. POIs provide context.
A school, hospital, or transport connection earns its place because it helps explain a development. The map should help the buyer read the portfolio, with enough surrounding information to make its locations understandable.
Geography that the developer can author
The geographic presentation is assembled around the story the property team needs to tell.
Its authoring tools cover several distinct jobs:
- Project markers identify developments and connect them to their project experiences.
- Shapes outline project areas or other relevant geographic zones.
- Lines describe access routes, connections, and infrastructure.
- Points of interest provide context around transport, education, healthcare, retail, leisure, and landmarks.
- Labels and signs give places and areas readable names.
- Saved views provide named geographic perspectives that buyers can move between.
The presentation also has an opening portfolio view and controls for the buyer's exploration area. These let the experience begin with a deliberate geographic frame.
Shapes, lines, points, and labels have styling controls. Directional flow can give an authored line a sense of movement. That movement is a presentation choice; it should not be read as measured traffic or a calculated journey time.
These capabilities sit within RegalScene's authoring environment, connecting map preparation to the wider property presentation workflow.
The developer chooses what the buyer should understand about the location.
From a location pin to geographic storytelling
A pin locates a development.
A geographic property portfolio can answer the next questions too. The project boundary shows the area being discussed. An authored access line makes an approach visible. A transport point or nearby amenity explains part of the surrounding context.
Consider a hypothetical developer with a city apartment project and a township farther out. The useful presentation is different for each.
The apartment project may need a close view of its district and transport connections. The township may need a wider frame that shows its extent and the roads connecting it to the city.
The same map system supports both, but the editorial choices matter. Too many unrelated places make the projects harder to read.
A useful geographic presentation explains relationships, rather than collecting markers.
Geography without breaking the sales journey
Selecting a project marker or a project-linked shape opens a project preview. From that preview, the buyer can enter the project.
Other authored elements can move the map to a saved view. A district label, for example, can bring the buyer into a closer geographic perspective without opening a property.
Those actions serve different purposes: one helps the buyer move around the map; the other takes them into a development.
Once inside a project, the existing experience continues. Depending on the content prepared for that project, the buyer can explore a master plan or interactive 3D experience, then move through buildings, floors, and units toward an enquiry.
Geography adds an earlier stage to the journey while keeping the property experience connected.
The path can now be:
Portfolio → Geography → Project → Master Plan / 3D → Building → Floor → Unit → Enquiry
That is a possible buyer journey, not a required sequence for every property. A land portfolio or resort can use the stages that suit its content.
Designed for property teams and their buyers
The authoring decisions are practical: which project to show, where its boundary belongs, which surroundings matter, and where a buyer should go next.
A marketing team can use the map to explain a portfolio. A sales team can begin a conversation with the wider location, then enter the development that interests the buyer.
The buyer presentation also responds to the screen being used. Geographic framing adapts to desktop and mobile, and project previews are arranged for the available space.
The developer can define the opening view and exploration area, while buyers can move through the map and use the available place and overlay controls.
Curated exploration gives buyers room to investigate while keeping the portfolio understandable.
Web GIS applied specifically to real estate
The term "real estate GIS" can describe a much broader set of activities than property presentation.
RegalScene's scope is specific. It connects geography, curated portfolio information, and interactive property experiences for sales and marketing.
It is not positioned as an ArcGIS replacement, a QGIS replacement, an enterprise GIS, or a general-purpose geographic analysis platform. Drawing a project boundary for presentation is not a claim of cadastral accuracy. Drawing a connection is not a routing calculation.
That distinction keeps the promise clear.
RegalScene's Web GIS capabilities help buyers understand where a project belongs and continue into the property itself.
For developers, the result is a wider starting point for the same commercial journey: from understanding the portfolio to exploring a property and making an enquiry.
The map is no longer just showing where a project is. It is becoming the front door to the portfolio.
Related reading:
- Interactive Property Maps for Real Estate Developers
- Multi-Project Master Plans and Portfolio Maps
- Interactive 3D Models for Property Sales
- Explore RegalScene
See how RegalScene can turn a property portfolio into an interactive geographic experience. Explore the platform or contact us for a demonstration.